All posts by admin

Physical and Digital Comparative Site Review

As a child of two educators, I have always found museums to be a constant attraction. Nearly every vacation I took as a child involved some museum or historic site. Museums and historic sites offer a glimpse into the past in a relatable and easy-to-understand way. That is why when I found out that our assignment for this week was to review a physical and digital historic sight or museum, I was very excited to visit the site to review. The site I chose to review for my comparative analysis is the Missouri History Museum in St. Louis, Missouri. I have visited this site before this analysis, but it was good to see the museum again in a different light.

Physical Site: Missouri History Museum

The Missouri History Museum, while not overly large, has other in-depth exhibits, so I focused on the permanent exhibit that has recently been completely renovated, “The 1904 World’s Fair.”  The quote below greeted me right outside the exhibit entrance near the Thomas Jefferson statue.
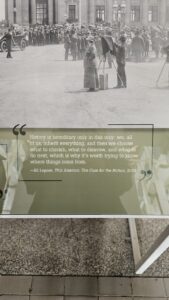
The exhibit has two components: the main exhibit and the rotating exhibit in the back of the main hall. The temporary exhibit changes every two years and is entitled “The World in St. Louis.” The first thing you experience when you walk into the exhibit is feeling like you are being transported into the fair itself. It is clear that the interpretation of the exhibit is to make the guests feel that they are a part of the fair and its history. This sense of bringing one into the fair does an excellent job of transporting the mind back to 1904 and the implications of what the fair meant for the city of St. Louis.  It becomes clear that the exhibit’s mission is to give the visitor a greater understanding of the significance of the World’s Fair to St. Louis and the process that hosting the fair meant. The fair was not just some tiny city fair but encouraged, acknowledged, and spread ideas worldwide. From the beginning of the exhibit, it is clear that the audience of this work is to engage children and adults to understand better some of the history of St. Louis and the World’s Fair project. This was the case the day I visited as there was a nice mix of adults and children, with more adults present, but I see this largely due to the fact the kid’s play area was across from the exhibit.

There is a timeline that traces the exhibit on the wall, which begins to the right, and makes a semicircle to the left. In the center of the exhibit hall is a large model of what the fairground looked like in 1904, and every few minutes, a projector displays the modern city of St. Louis over the map for the viewer to situate themselves.  Even with the timeline, however, the flow of the exhibit does not provide  singular viewing, as there are no clear instructions on where to begin, mainly due to the model disrupting the flow. Once the viewer starts, it becomes clear how vital the fair was to the city and how elaborate the planning was. Some of the artifacts that are on display that the viewer sees right away are cultural representations of the fair, particularly a display on the famous 1944 movie Meet Me in St. Louis, starring Judy Garland. The picture below represents her wardrobe from the movie. These were temporarily on loan during my visit.
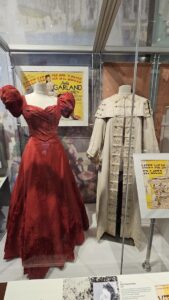
However, as the exhibit continues, other artifacts are displayed, such as governmental documents approving the fair, the commirative metals sold to raise money for the fair, and artifacts from various countries exhibits. The country exhibits highlight how much the world contributed, not to mention the different lectures and activities the fair provided. The information about the exhibited items is supplied on plaques in front of each display case that houses the items. Various fun facts throughout are also about different aspects of the fair, mainly the famous Ferris Wheel, which is used to catch the eyes of younger guests. This exhibit does not contain many interactive features, with only one present on both ends of the model. It has a collection of historical pictures of various fair phases, which is interesting for older viewers but not for younger visitors.

As one continues, they are drawn to the furthest and temporary exhibit, “The World in St. Louis,” which provides facts about the countries that contributed, as the pictures below show.
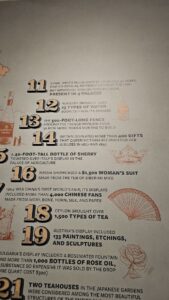
The facts about the British contribution were exciting due to my research on Queen Victoria. Along side this view, there is also a large selection of porcelain vases and paintings that many had commissioned and purchased.

Overall, as a native Missourian, I found the exhibit to be fascinating and informative. However, there are a few issues with the project as well. The most significant being that there were no docents or staff along the way to assist guests in better understanding the museum. The only staff member I saw manned a desk at the entrance, and that was it. Since the museum is a not-for-profit, this could be why there were not many to assist. Besides this, I also think the exhibit flow needs to be reconfigured, especially since the flow is confusing. If there were a more interpretive sign or staff member pointing the way, this would help tremendously. I must say that this exhibit is a vast improvement over their previous exhibit. Despite my criticisms, this is still a valuable and much-needed free resource disseminating history to its many guests.

Digital Site: Missouri History Museum Website

The website is similar to the actual museum, as it is a medium of promotion for attracting visitors. However, the museum website is also in conjunction with the Missouri Historical Society, which adds more research and takes away from the overall impact of the museum. The website attempts to embody the argument that not only is the history of St. Louis important, but the 1904 World Fair is also a turning point in the history of the city and the state of Missouri. It also seeks to examine the fair in terms of many multicultural interpretations from the various exhibits. Beyond this, it aims to explore the lasting impact the fair created and how that legacy lives on until this day. The website’s design states in clear and straightforward language what the exhibit’s mission is, and it also creates the interpretive point of view that is to reintroduce the fair and all of its glory.

The flow of the website is relatively straightforward as there is a dedicated museum page that allows the viewer to plan their visit or look at the permanent exhibits. It also links to the collection of digitized artifacts held by the Missouri Historical Society. This aspect is more clearly aimed towards researchers and historians who wish to use the resources provided by the historical society. These are not to be found or seen at the physical museum and are unique in the digital location.  The user can also click on the various exhibits, particularly concerning the World’s Fair, to better understand the exhibit and what it entails. This aspect of the digital site caters more to the general public and those who wish to plan their visit to the museum. This simplistic nature of the website also allows for a singular flow for the user. With this singular flow, the viewer is encouraged to not only plan a visit to the museum but also provide helpful blog posts and articles that allow for a better understanding of what some exhibits entail and engage them to visit the museum. While direct contact with the curators and  organizers is not directly encouraged, there is a generic Contact Us link that the user can utilize. The digital experience is exciting and helpful for a visit. Still, since it is directly connected to the Missouri Historical Society, it confuses what one can expect. Separating the sites would help immensely with the user’s experience.

Comparative Review and Final Thoughts

Overall, the two sites offer a more profound understanding of the significance of the 1904 World’s Fair for the city of St. Louis. Both provided an accessible experience for all ages and allowed viewers to interact, even if it was slight, to gain a clearer understanding of history. Even if the museum is primarily dedicated to the history of St. Louis and not the state of Missouri, this does not take away from its importance as a free institution and place of learning for the community and state.
Revising Review Guidelines

The readings from this module and the previous week’s module detail the vast and ever-changing nature of public and digital history. Each of these subfields continues to change and expand the field of history. Even with the tension being observed as early as 1981, as Ronald J. Grele demonstrates, the two fields need each other even if the other does not see that. However, even with the similarities, there is somewhat of a stark difference between the two regarding expectations and questions that seek to be answered. As the reading shows, Robert Weible poses many of these questions and offers validity to understand better how public history fits into the larger field of university-level academic history. But as Micheal Frisch famously suggested, “that historians and their audiences learn from each other and share authority for creating a more meaningful and usable past” (Weible 2008).

This consideration must be accounted for when viewing the guidelines established by the OAH regarding digital history reviews. Consequently, the categories of content, design, audience, digital media, and creators fit perfectly into the theme of digital history. Not only do these categories directly apply to digital research, but for the most part, they apply to historical scholarship of any kind. The ” content ” category applies to any project, particularly public history, because it generally asks what the project is about. Why is the material important? As for “design,” while this aptly fits those reviewing digital projects, it, for the most part, fits public history projects as well. The categories of “design” and “audience” in public history should be closely linked together and could be combined to form the category of audience engagement or accessibility.  Public history seeks to bring history to everyone and allow for mutual understanding; this should be directly interpreted in terms of how an audience perceives and understands a project. But beyond this, the project should be easy to navigate so there can be as little confusion as possible. The design aspect of the accessibility also ties in as the information should be easy to comprehend. As for the category “digital media,” this too could largely be absorbed by the accessibility category, as digital platforms essentially involve making the content accessible, especially for those with some form of disability, which needs to be noted when pursuing public history. This form of digital media should come in subtitles or other means of helping guests better understand your project. Not to mention, if it followed the questions asked in the subcategory of “digital media”, the questions posed answer the nature of public history projects as they are primarily museum exhibitions. Finally, the category of “creators” is vital for any type of media project as it not only gives credit where it is due but also shows if the project is done by multiple people in different capacities. If there is an issue with that part of the project, the viewer knows exactly who to speak to or if that person has a bias. Public history and digital history are relatively similar in some regards. Still, as these past few weeks of reading have shown, the guidelines can be changed just a bit to accommodate the unique nature of public history better.

Introduction: Digital Public History

Hello, everyone. I am Lydia Pensel, a second-year PhD student at Southern Illinois University Carbondale. I predominantly study European history, with an emphasis on British history. My experience with digital humanities is relatively limited. The only experience I have outside of the Introduction to Digital Humanities course I took last semester is as the coordinator of the undergraduate podcasting project in my department.

Regarding what interests me in public digital humanities, I am interested in almost every aspect of utilizing and creating digital humanities projects. I have been well versed in technology since I was a young child, and digital humanities provides me the means of combining my two loves, history and technology. Beyond this, I am a staunch advocate for public history because, as an educator, I aim to share my knowledge in an accessible way with the general public to create connections and share information. Both of my parents are educators, so almost every vacation I took as a child included some form of a museum or historical site, which means that public history is deeply ingrained in my life. My learning goals for this semester are relatively simple: to better understand the significance of public history and how digital public history can be disseminated to everyone in an accessible and easy-to-understand manner. I also want to fully understand what public history entails and discover what projects I can use in the future, especially when I finish my PhD.

I look forward to this semester and the valuable information I will learn.


(Re)Defining Digital Humanities

When I started this class, I had a very vague understanding of the digital humanities. One of our first activities was coming up with our own definition of the digital humanities. My definition was an interdisciplinary field of study that draws inspiration from the humanities and uses technological computing to expand, disseminate, and improve previous research and share these ideas with the public. As I have directly worked with digital humanities throughout this semester, there are clear areas in my first definition that were correct in my assumptions. The digital humanities are directly related to the field of humanities, which is continuous throughout this semester as we looked at projects that utilized works mainly from history but other fields, such as anthropology and sociology. When engaging with the humanities also leads to an interdisciplinary nature that allows for diverse ideas across many fields. Throughout this semester, technological computing was also highlighted in many different ways, particularly in creating data visualizations and data analysis. This semester has also emphasized expanding and sharing digital research with the greater public. One of the core tenets of digital humanities research is to share academic research with the wider public so they can understand and value it. Sharing ideas with the public is a central aspect of digital humanities.

I would keep some aspects of my definition, but I would replace or clarify some now that I have a deeper understanding since I have been directly working with the material. The first aspect that I would change is that instead of using the generic and vague term of technological computing, I would expand this and provide specifics such as data visualization, text mining, digital mapping, and crowdsourcing. By just saying the term technological computing does not show the potential and extent of what can be done with digital humanities. Not only can patterns be observed, but data can be seen in an entirely different way. Another key area that needs not only clarification but to be wholly changed is the phrase “expand, disseminate, and improve previous research.” These processes of expanding, sharing, and improving are aspects of digital humanities, but they also negate the pivotal element of creation. Digital humanities projects create new methods of research and ideas for inquiry. They might expand on previous research, but each project creates something new and different that allows others to see that work in an entirely different light. This semester has taught me so much, not only about various methods of creating digital humanities projects but also about how essential digital humanities is for the future of research. This class has become a guiding light for my future research.

Podcasts and the Digital Humanities

Podcasts are part of almost everyone’s daily lives. They not only act as a means of connection to a broader community but also allow for the dissemination of information to the wider public. I feel very passionate about podcasts because I am in charge of my undergraduate history department podcasting project, where I produce, record, edit, and publish podcasts. A podcast has so much potential that it can not be achieved within a regular medium such as text. First, podcasts, particularly historical podcasts, allow listeners to interact directly with the subjects they are learning about. This can be heard through oral histories, interviews, and other forms. As the podcast Throughlines highlighted it the episode “The Lavender Scare,” oral history interviews can be directly shared. This creates a greater intimacy with the audience and a direct connection between the listener and the storyteller. A direct oral interview can be shared, and a reading of the subject works also creates a greater connection. Podcasting also allows for those who are auditory learners to understand better information that they can not as easily comprehend in text form. Beyond this, podcasts are also critical for their ability to be shared with the wider world. One of the most essential aspects of podcasts and digital humanities is accessibility and whether the general public can find work. With a podcast, nothing is more important than sharing your work with the world. This can be shown directly in the project I work with as the undergraduates who participate in the project use their research paper to share with the world and create our own digital form of student-published journal. Their research can reach a wider audience and inform the masses with a podcast.

Podcasts not only exemplify the key factors of digital humanities projects, such as data visualization with Voyant and mapping with Kepler .gl, but they also share projects with the greater public. These projects show how digital humanities scholarship can use a multidiscipline approach to data, information, and sources to create a project with various mediums. Not to mention that podcasts and other digital humanities projects are primarily collaborative and allow for many to work on a project together. This allows for varying perspectives and critical contributions that are not the same in traditional scholarship.  Academic scholarship is outstanding for academics, but digital humanities projects and, specifically, podcasts create a means of disseminating one’s work to a broader audience and, in turn, enriching the lives of others. Intimacy in listening to a subject’s voice, such as a historical figure or just an everyday person, perpetuates the principles of digital humanities and creates something exceptional for the world.

What Can Digital Humanities Do With Crowdsourcing?

Before working specifically with crowdsourcing in the digital humanities within this unit, I was very unfamiliar with community projects such as Transcribe Bentham, which we worked with, and Zooniverse, as mentioned in this unit’s reading by Mia Ridge and her fellow authors. The context I knew of crowdsourcing was mainly similar to crowdfunding projects, where you contribute financially. Once I worked with Project Bentham and By The People, I fully understood the implications and importance of crowdsourced projects within the digital humanities.

First, transcription is the type of task within digital humanities that works well with crowdsourcing. As the projects we specifically worked with showed, using crowdsourcing to view and transcribe documents such as letters, journals, and other written material is valuable. Not only can others view things that some may have missed, but with extensive collections such as the By The People, the more hands involved make for less work for each person. This shares that collection of information with the public, allowing those who may not have much interest in the subject to learn and interact with a person’s works. Another task that works well with crowdsourcing is including data annotations, categorizing, and inputting metadata. Many museums and archives are overwhelmed with the number of items and data that need inputting; thus, if they turn to a crowdsourcing model, they can not only engage in completing these tasks faster but also gain more interest in the wider world. Finally, crowdsourcing to create oral histories and storytelling in the broader community creates a more extensive digital archive. It allows those in the general public to be directly involved in significant events while sharing their own stories. As a historian, I also have to look at the value of recording history for the future as never being a bad thing.

Another aspect of crowdsourcing crucial to the project’s success is engaging and retaining those involved. The most important key to the success of a crowdsourcing project is the user interface; if the software being used is complicated to work with, then the users will stop using it. I intercountered this directly within the Transcribe Bentham, since it was one of the first projects of its kind, the software was complicated to work with. Not only were the images not high quality, but the interface did not allow the user to engage in the work as closely as possible. This highlights how critical it is for interfaces with crowdsourcing material to be simplistic and have the required tools for the user to succeed. In the case of transcription, high-quality images are a must. Beyond the interface, another key factor is that the project needs to have clear goals and outcomes to avoid confusion about what the user is contributing to. Every project must make clear what they want to achieve and what they plan to do with the work when it is completed. Finally, a crowdsourcing project needs clear tutorials, instructions, facts, and support for the users to have all of the tools to be successful in helping the creators achieve their goals. If there are no clear instructions or a support page to assist the users, they will likely not even engage in the project. Crowdsourcing allows many different organizations, archives, and museums to interact directly with the public in a new way that allows both parties to gain and work together, which leads to a brighter future for digital humanities and humanities in general.

How to Read Crowdsourced Knowledge

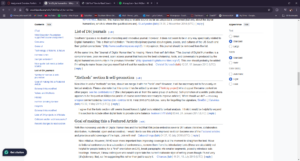
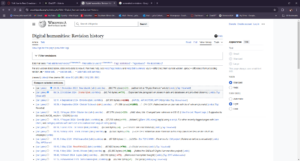
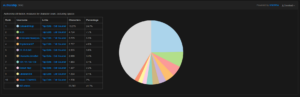
During this module, we were asked to examine the inner workings of the Wikipedia entry on digital humanities. Explicitly using the Talk and History pages to discover new information. While I have used Wikipedia for many years, I had no idea about the immense knowledge one can learn from diving deeper into the page. The history page, in particular, shows the user the revision history, as the included image shows, but it also shows who and what has been added. The revision history is essential to track how the page has changed and what and who is adding items. As the following image shows, users can also access who has contributed the most and what they said within the history. One can also click on the user’s biography to find out more about the perspective that the author is adding. One can determine pretty quickly whether the authors are someone who should be adding to the page or not.
Beyond revision and authors, the history sections show the page’s development over time. Accessing pages familiarizes users with crucial information about how that page has changed over time and, most importantly, how the field has changed. This includes when significances occur throughout time, like the release of new software or a new medium.  Digital humanities has changed immensely even in the last few years, and the Wikipedia page highlights this.

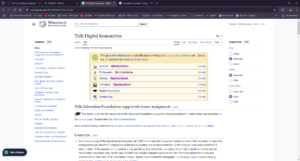
The page’s talk aspect, as shown in the image below, highlights the specific topics editors find to be of the utmost importance.

History and literature are listed as a high priority, showing what is currently emphasized in digital humanities. The talk page also shows what sources are being used and what users are debating should and should not be included. As the image

highlights that various discussions are happening regarding other sources and methods. The talk page allows the users who contribute often or rarely to engage in communal conversation to improve that page and create the best version to share with the public.

Deconstructing a Wikipedia page not only assists in gaining a better understanding of how Wikipedia pages are created and edited but also allows the user to understand who is contributing to the page. Since anyone in the public can edit, it causes misinformation and incorrect assumptions, leading to AI’s use for crowdsourcing knowledge. After evaluating and testing ChatGPT, I found that AI tools pull quite a bit of information from Wikipedia pages. This creates several issues if incorrect information is shared through Wikipedia; it is now disseminated through another source rather than just Wikipedia. Not to mention, some users could deliberately create misinformation to be shared throughout the world to further their motivations. While Wikipedia and ChatGPT can help find quick, straightforward information, one should be extremely careful when using it for more complex subjects as it can easily mislead.


Network Analysis with Gephi

Adding to the various software that we have worked with throughout this unit is Gephi, which allows the user to create network analysis graphs. Again, after viewing the example projects of Viral Texts, the Tudor Papers, and Linked Jazz, I thought I would be in way over my head. I especially felt this after viewing the Tudor Papers and the sheer number of paths that were charted with the letters and people that sent them. After I viewed the Linked Jazz project, I felt a bit better. So, when I began working on the data from the African American Films from 1909 to 1930, I better understood what I was getting myself into. Uploading the data was very simple after installing Gephi.  The first method of evaluating the data from the films was viewing the connections between the movies and actors. The below bimodal graph highlights this.

Not only can you customize the data’s color, background, and theme, but each point links you to the films the actor was in. Beyond this, you can also see the average distribution of the number of movies the actors participated in. This provides a better understanding of what the average number of films that the actors were in.

After working with the first data analysis, the second one showed the communities and connections between actors and specific films. Not only does it create groups based on shared projects, but you can also single out particular groups and evaluate the group members even closer. This fosters greater connections throughout the data. The below graph illustrates this.

Finally, when working with the data, you can expand the communities into an unimodal graph that charts all of the connections between the groups. After looking at the graph below, one begins to understand the vast network of the African American film industry in the 1900s.

Working with network analysis creates connections with the dataset and shows the broader picture of what that data is trying to tell the scholar. Gephi, in particular, was not only a relatively easy software to work with, but its vast customization and varying types of models create a wide array of options to represent one’s data.  It allows for scholars to answer basic questions such as: how are the various datasets connected? What are the patterns throughout the data? Are their specific data points more connected to others in the dataset? What is the overall significance of this data? This unit’s modules showed me the importance of data creation and representation and how much can be done with software relatively easily. Gephi unlocks the potential for researchers to create much more from their work.

Mapping with Kepler.gl

Working with digital mapping, this module truly showed me how much can be done with even a small amount of data. When viewing projects such as Photogrammer, the National Mall, and Mapping the Gay Guides, I was a bit overwhelmed by the vast extent of each project. An immense amount of time and effort seemed to go into these projects, not to mention the sheer amount of data. While this is not a bad thing, it just seemed to be a significant undertaking before I explicitly began working with Kepler. gl. It was not until I started working and using the Works Progress Administration’s Slave Narrative project that I better understood and was able to map out the locations of the various formerly enslaved individuals interviewed in Alabama. Before working specifically with Kepler.gl, I was familiar with digital mapping platforms such as Datawrapper, but I had never specifically worked with any software. Therefore, when I started working with Kepler.gl, I was pleasantly surprised when I found the software to be highly user-friendly and knowledgeable. After simply uploading data, the user can use various tools, such as different layers, to demonstrate and evaluate their data. One layer is merely pointed on the map to locate your input data. This can help you understand the overall coverage of your data.   Specifically for the slave narratives, it shows the vast space in which those were located. The graph below illustrates that.

You can also change the color of your points and the theme of the map that it is located on to assist with viewability. Another interesting layer that can be applied is a cluster layer that creates larger bubbles based on the proximity of the point’s location. Those that are large bubbles help illustrate the areas where the most people were interviewed and also show the relative location of the larger areas of enslavement. The heat map layer also shows the proximity but does so based on the color gradient of numbers. The graph below illustrates that.

Another factor that can be examined with the tools in Kepler.gl is charting the various types of slaves that those who were interviewed were. The graph below shows the varying nature of enslaved people in the house, field, or both.

Working with Kepler. gl is a valuable tool that not only can map out the locations of various data points, show the frequency for which they appear, and show varying specific information, but it can also show a timeline of when the data occurred. Data mapping not only creates another dimension to digital humanities data, but it is able to answer the questions of: where are the highest frequencies located? What changes occurred over time? Was one location’s conditions unique to that area? What are the patterns throughout the areas mapped? Digital mapping allows endless possibilities for data and for the scholar working with it, and I very much enjoyed working with Kepler.gl.


Text Analysis with Voyant

This module focused on the various forms of text analysis. When I began working on this unit, I was powerfully overwhelmed by the potential that data mining had. As someone who works in the humanities, but in history, the idea of data and vast amounts of it honestly scared me. It was not until I evaluated the various projects, such as America’s Public Bible and my favorite Robots Reading Vogue, that I better understood the importance of data mining. When I specifically worked with the data from the Works Progress Administration’s Slave Narrative Projects data, did I fully understand the critical importance and the essential questions data mining seeks to answer?

Working with Voyant, I learned the key ideas of text mining and the potential a corpus could bring, especially when working on a project with a great amount of data. After uploading the data that I was provided, Voyant created this extremely helpful textual analysis of various aspects of the narratives. Not only could one find the recurring words that appeared throughout many of the narratives, but it also allows you to see where certain words appear in the document and the context surrounding them. With Voyant, there is so much potential to evaluate trends, connections, and context throughout large data portions.

Voyant also allows the user to narrow their data into smaller subsections, such as individual states. The cirrus below is a visualization of the most common words featured in the slave narratives recorded in Missouri. Since I am from Missouri, it was fascinating to evaluate the stories of the formerly enslaved and this data in the larger picture.

This cirrus represents the most common words in Ohio, which differed from those in Missouri. Voyant allows users to compare and contrast critical factors, such as common words, throughout their different data options. This also highlights the differing experiences of the enslaved just a few states away.

Beyond the aforementioned, Voyant allows the user and creator of the data to see vast differences in frequency. In the graph below, I evaluated how the states of Missouri and Ohio differed in their use of the word “Old” in the narratives. Missouri had a much greater relative frequency for the word “old” than Ohio. This, too, highlights the importance of data mining and drawing conclusions based on the data.

Finally, this tool on Voyant summary shows the researcher various comparative issues within the data, whether it be the length of the document, the varying vocabulary, or even distinctive words. The distinctive words section is mainly what I focused on as I drew comparisons between Missouri and Ohio, as well as the larger picture of other states.

When I first began working with text mining and its surrounding process, I was terrified of what it entailed. However, after working with Voyant and seeing how significant data visualization and analysis is, I fully understand not only how important this work is, but with tools like Voyant, the process can be far simpler.